Learn How to do 3 Advanced Excel Tasks in Python

Excel is the ubiquitous data analysis tool — it’s easy to pick up, mostly everyone has a copy of it, and it’s quite powerful once you get the hang of it! Meanwhile, Python is often regarded as a bit more challenging to pick up, but as having limitless potential. In this post, we’ll explore three things you can easily do in Python that you normally do in Excel!
Setup
For debian based distro you must install python pandas and xlrd packages first:
~] apt-get install python3-pandas python3-xlrd
We’ll begin by import pandas and loading two dataframes based on the sheets available in our workbook. We’ll call them sales and states.
import pandas as pd
sales = pd.read_excel('https://github.com/sk-rama/data_learning/raw/master/pythonexcel.xlsx', sheet_name = 'sales')
states = pd.read_excel('https://github.com/sk-rama/data_learning/raw/master/pythonexcel.xlsx', sheet_name = 'states')
Let’s image we ran the .head() method on the dataframes, as sampled below:
print(states)
            City     State
0        Atlanta   Georgia
1  New York City  New York
2        Toronto   Ontario
3       Portland    Oregon
print(sales)
         Product  Sales       Date           City
0        Bananas    121 2019-06-13        Atlanta
1        Bananas    236 2019-10-20        Atlanta
2         Apples    981 2019-03-12        Atlanta
3          Bread    996 2019-07-28  New York City
4       Brocolli    790 2019-10-22  New York City
5         Apples    762 2019-11-03        Toronto
6        Bananas    870 2019-11-18  New York City
7        Bananas    852 2019-03-21        Atlanta
8         Apples    427 2019-05-11        Toronto
9          Bread    576 2019-09-14        Atlanta
10       Bananas    472 2019-04-06  New York City
11       Oranges    864 2019-06-02        Atlanta
12  Strawberries    923 2019-03-30        Toronto
13      Brocolli    925 2019-06-09       Portland
14       Bananas    281 2019-04-23       Portland
15         Bread    809 2019-10-20       Portland
16       Bananas    916 2019-12-08        Toronto
17      Brocolli    705 2019-01-17  New York City
18       Bananas    710 2019-10-14  New York City
19  Strawberries    486 2019-03-16        Atlanta
20      Brocolli    791 2019-01-02        Atlanta
21  Strawberries    784 2019-04-02       Portland
22       Oranges    148 2019-08-10        Atlanta
23  Strawberries    126 2019-02-18        Atlanta
24         Bread    192 2019-02-07  New York City
25        Apples    574 2019-03-02  New York City
26       Oranges    113 2019-03-23        Toronto
27        Apples    733 2019-12-13        Toronto
28         Bread    587 2019-09-28  New York City
29      Brocolli    867 2019-03-29        Atlanta
30       Bananas    447 2019-04-25        Atlanta
31         Bread    694 2019-09-09  New York City
32  Strawberries    420 2019-03-18       Portland
33       Bananas    695 2019-12-02        Toronto
34      Brocolli    447 2019-06-20        Atlanta
35       Oranges    839 2019-04-06       Portland
36      Brocolli    672 2019-05-06        Toronto
37         Bread    984 2019-05-04        Toronto
38  Strawberries    849 2019-09-24        Toronto
39         Bread    224 2019-11-19        Atlanta
40        Apples    566 2019-06-01        Toronto
41        Apples    127 2019-02-26        Atlanta
42       Oranges    173 2019-01-10       Portland
43      Brocolli    512 2019-11-15  New York City
44         Bread    783 2019-05-23        Toronto
45        Apples    489 2019-10-12        Toronto
46         Bread    904 2019-10-28  New York City
47       Bananas    243 2019-08-12  New York City
48  Strawberries    349 2019-04-23        Atlanta
49      Brocolli    659 2019-06-26        Toronto
We can compare this to how the data would look in Excel:
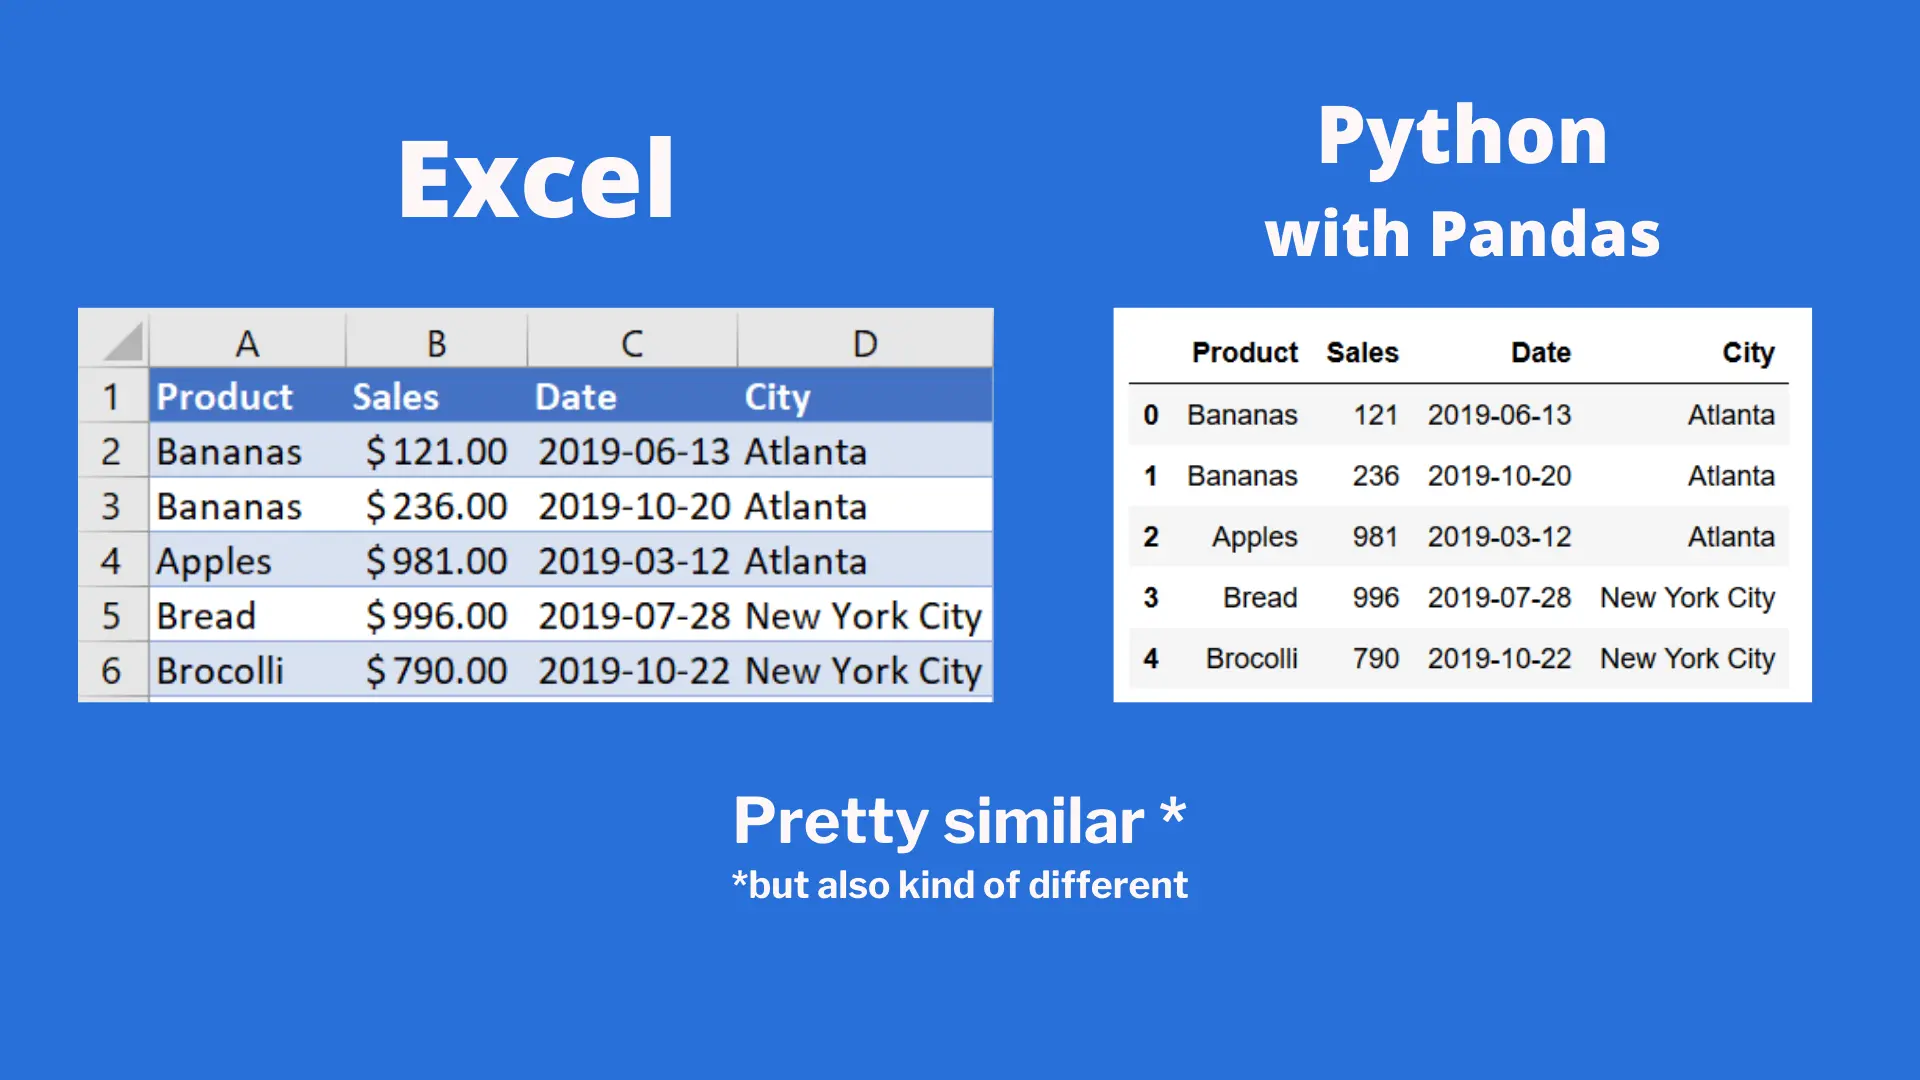 Comparing how data is displayed in Excel vs. Pandas
We can see the data that’s displayed is relatively similar to how Excel would display the data, but there are some key differences:
-
Excel starts at Row 1, while Pandas starts at row ('index') 0
-
Excel labels columns with letters starting at A, while Pandas labels the columns with variable names
Let’s begin to dive into how to work with Pandas to complete Excel tasks.
IF Functions in Python
Using IF functions in Excel is pretty handy and allows us to apply a certain label based on a condition in another cell. Let’s say we wanted to create a new column that lets us know if the value in a cell in column B is greater than 500. In Excel, we’d label Column E MoreThan500 and we’d go into Cell E2 and write in:
=IF([@Sales]>500, "Yes", "No")
 Applying an IF Function in Excel
If we wanted to do this in Pandas, we could use list comprehensions to easily apply the same if statement:
sales['MoreThan500'] = ['Yes' if x > 500 else 'No' for x in sales['Sales']]

print(sales)
         Product  Sales       Date           City MoreThan500
0        Bananas    121 2019-06-13        Atlanta          No
1        Bananas    236 2019-10-20        Atlanta          No
2         Apples    981 2019-03-12        Atlanta         Yes
3          Bread    996 2019-07-28  New York City         Yes
...
46         Bread    904 2019-10-28  New York City         Yes
47       Bananas    243 2019-08-12  New York City          No
48  Strawberries    349 2019-04-23        Atlanta          No
49      Brocolli    659 2019-06-26        Toronto         Yes
List comprehensions are great tools for this kind of work, which reduces the need to write complex if/else statements. You could accomplish the same thing with an if/else statement, but this saves time and make the code a little cleaner. You can learn more about list comprehensions in detail by checking out this article .
VLOOKUP in Pandas
In our dataset we have cities on one sheet and states/provinces on another. This isn’t ideal, but we can use VLOOKUP in Excel to link the data. A VLOOKUP works similarly to a left join, where every record in the left dataset is retained. We tell Excel to look vertically up and down a column for a specific value in a lookup table and then return a value that sits a certain number of columns to the right of it.
Let’s add a column called 'State' and use VLOOKUP to return the corresponding state from the states table.
 Using VLOOKUP to add state/province information
In Python, we can accomplish the same thing using the Pandas merge function. Merge takes two dataframes and merges them. To accomplish this, we would write the following code:
sales = pd.merge(sales, states, how='left', on='City')

print(sales)
         Product  Sales       Date           City MoreThan500     State
0        Bananas    121 2019-06-13        Atlanta          No   Georgia
1        Bananas    236 2019-10-20        Atlanta          No   Georgia
2         Apples    981 2019-03-12        Atlanta         Yes   Georgia
3          Bread    996 2019-07-28  New York City         Yes  New York
4       Brocolli    790 2019-10-22  New York City         Yes  New York
5         Apples    762 2019-11-03        Toronto         Yes   Ontario
6        Bananas    870 2019-11-18  New York City         Yes  New York
7        Bananas    852 2019-03-21        Atlanta         Yes   Georgia
8         Apples    427 2019-05-11        Toronto          No   Ontario
...
45        Apples    489 2019-10-12        Toronto          No   Ontario
46         Bread    904 2019-10-28  New York City         Yes  New York
47       Bananas    243 2019-08-12  New York City          No  New York
48  Strawberries    349 2019-04-23        Atlanta          No   Georgia
49      Brocolli    659 2019-06-26        Toronto         Yes   Ontario
Let’s break this down argument by argument:
-
The first argument is the original dataframe
-
The second argument is the dataframe we’re looking up values in
-
How specifies the type of join we want to make
-
On specifies the variable that we want to merge on (there’s also left_on and right_on if the variables are called different things in each dataframe)
Pivot Tables in Pandas
Pivot tables are one of Excel’s most powerful features — they allow us to extract meaningful data about large datasets incredibly quickly. Let’s create a pivot table on the sum of sales per city.
 Generating a pivot table in Excel
To do this, we simply drag the City field into the Rows section and the Sales field into the Values section. Automatically, Excel totals up the sales for each of the cities in our dataset.
To generate the same pivot table in Pandas, we would write the following code:
sales.pivot_table(index = 'City', values = 'Sales', aggfunc = 'sum')
               Sales
City
Atlanta         7642
New York City   8249
Portland        4231
Toronto         9571
Let’s break this down again:
-
We use sales.pivot_table to let Pandas know we want to create a pivot table based on the sales dataframe
-
Index specifies the values we want to aggregate by
-
Values specifies the values we want to aggregate
-
aggfunc specifies the function we want to use (we could also use mean, max, min, etc.)